From 0 to 27K Search Impressions on a Developer Portfolio in 90 Days
13 May 2026

I rebuilt my portfolio site earlier this year. Three months later, Google Search Console showed 27,000 impressions and 46 clicks. Not viral numbers, but for a personal dev portfolio it's not bad.
The data I tracked was Search Console data, git commits, and content publish dates. Here's what I found when I overlaid them. Your numbers and timeline will look different, but the patterns might not.

The setup#
My site runs on Next.js with Sanity CMS. Before February 2026, I had a basic portfolio with projects and blog posts imported from Medium. They have been living there for a while because it was easy to write there: good editor, built-in audience, nice formatting out of the box. But that meant all the SEO value was going to Medium, not to my own site. The site was getting maybe 1-2 impressions per day, mostly from branded searches like "snaijer" or "de snaijer."
So the plan was: make my own site the primary home for my content. I rebuilt the blog infrastructure in Sanity CMS with the same features that made Medium comfortable to write on (code blocks with syntax highlighting, copy buttons, embedded demos). Then I set up canonical links on the Medium versions pointing back to my site. That tells Google "the original lives here, not on Medium."
This turned out to be one of the most impactful decisions in the whole timeline.
Three data sources, one timeline#
To figure out what actually worked, I combined three things:
- Search Console (Feb 1 - Apr 30, 2026): daily impressions, clicks, queries, and positions
- Git commit history : every change I shipped, with dates
- Site content: blog post and project publish dates, page structure, and metadata
Laying these on top of each other makes the cause-and-effect surprisingly clear.
What happened, phase by phase#
February: the foundation (0-11 impressions/day)#
In late January and February, I shipped a bunch of structural changes. The kind of work that doesn't show up in traffic immediately, but sets the stage for Google to understand your site.
What I shipped:
<meta>tags so Google had proper titles and descriptions to show- Video support for project pages
- Tag page infrastructure and "related projects" sections to improve internal linking
During this entire month, I got exactly 1 click. Total. But looking back, none of this was wasted. Google was indexing the site structure, and the internal linking gave it more pages to crawl.

Early March: the blog migration (6-22 impressions/day)#
On March 7, I merged the blog migration. This was the real upgrade: proper meta tags, structured URLs, tag pages, and all the SEO infrastructure that the old import was missing. Likely the single biggest change I made, and the growth that followed strongly correlates with this deploy.
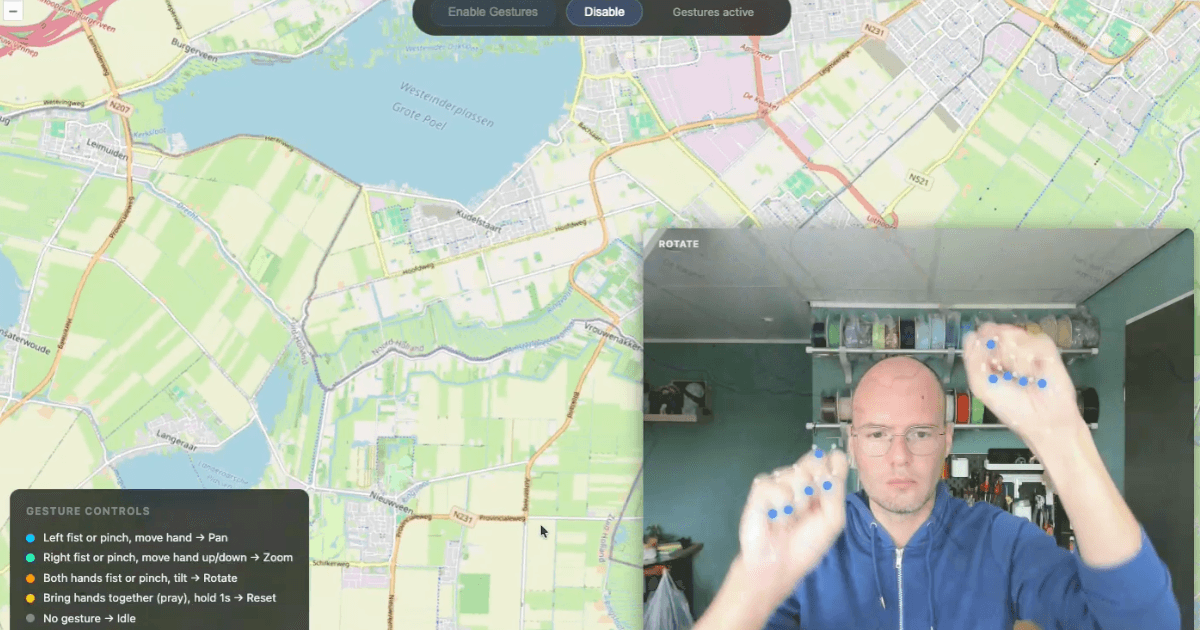
The same day, I also fixed the XML sitemap parser so it wouldn't choke on special characters. After that deploy, the blog went from bare-bones imports to fully structured technical articles, including one about MediaPipe hand tracking and face detection in JavaScript. That one post would go on to generate 85% of all my search impressions.
The next day I shipped Open Graph images for every blog post (so links look good when shared), "related posts" suggestions at the bottom of each article, and security headers.
Impressions went from ~3/day to ~15/day within a week. Modest, but the trend was clearly moving up.
Mid-to-late March: making content discoverable (15-47 impressions/day)#
This phase was about making the content easier for both Google and visitors to find.
- Redirect fixes: Made sure old URLs pointed to the right pages. Critical if you're migrating content and don't want to lose whatever link equity exists.
- Browsable tags overview page: Built out tags/mediapipe and similar pages so visitors (and Google) could explore content by topic. That MediaPipe tag page alone picked up 40 impressions and a click.
- Code block styling and cross-links: Cleaner formatting likely helped visitors navigate the content more easily, and linking between related posts keeps people on the site longer.
- Copy code button Small UX improvement, but it makes technical content more useful and shareable.
By the end of March, I was hitting 47 impressions/day. Still no hockey stick, but steady growth.
March 31: the Medium boost#
On March 31, Level Up Coding published my MediaPipe face tracking tutorial on Medium. This is where the canonical link strategy from the setup starts paying off. The Medium version links back to my site as the original, so Google sends the ranking power my way while I get the reach of Medium's audience.

The timing lines up: the article went live on March 31, and the big impression jump started about a week later on April 6-7. External backlinks from established publications are one of the strongest ranking signals there is. If you can get your technical content picked up by a publication, do it.
Early April: the re-indexing wave (78 to 1,288 impressions/day)#
Around April 6-7, impressions jumped from 78 to 873 in 2 days. No single change caused this. It was the cumulative effect of everything shipped in March, finally hitting Google's index.
Google's documentation states that crawling can take a few days to a few weeks, and ranking takes longer still. Ahrefs found that most SEO changes take three to six months to show results, though low-competition long-tail keywords can rank much faster.
Everything from March reached critical mass right here, about 4 weeks after the first deploy.
Late April: FAQ schema and the 6K spike (500-6,335 impressions/day)#
Traffic settled into a plateau of 600-1,300 impressions/day through mid-April. Then on April 29, it spiked to 6,335 impressions in a single day.
That spike lines up with two changes from April 28-29:
- FAQ schema: Added structured FAQ data to blog posts
- New content type support: Expanded what kinds of content blocks the blog could render (tables, embeds, internal links)
Did the FAQ schema cause the spike? Probably not. Google had already limited FAQ rich results to authoritative government and health sites back in 2023, and while writing this post, they dropped FAQ rich results entirely. The markup won't hurt anything, but it's not earning visible rich results anymore.
More likely, Google re-crawled the pages after the structural changes and picked up more queries. I don't have a definitive answer for what caused this one.
What the data actually says#
One blog post drove almost everything#
The MediaPipe hand tracking post accounts for 23,340 of the total impressions (84.8%). The top queries are almost entirely mediapipe-related: facemesh landmarks, hand tracking CDN URLs, JavaScript examples.
This is not surprising. The post targets very specific long-tail developer queries with little competition. Someone searching for "mediapipe facemesh landmark 61 291 mouth corner" wants something very particular, and few pages answer that.
Traffic is almost all desktop#
97.8% of impressions came from desktop (26,590 out of 27,188). That makes sense for developer content. People search for code solutions while they're coding, and they're at their desk when they do it.
Good positions, low CTR#
The site's average position is 6.9 (first page of Google), but the CTR is just 0.17%. For the main blog post, it's even lower: 0.07% CTR at position 6.6. That means the content is ranking well, but the title and meta description aren't compelling enough to get clicks. This is probably the highest-leverage thing to fix next.
The "resin stained glass" opportunity#
One query stands out: "resin stained glass alternative technique" got 1,388 impressions with zero clicks at position 6.55. That's a lot of people seeing the result and scrolling past it. A better meta description or a more specific title could turn some of those impressions into actual visitors.
Four takeaways for other devs#
- Your blog is your SEO engine, not your portfolio page. My projects page got 68 impressions. A single blog post got 23,340. If you want organic traffic, write about what you built, not just list it.
- Infrastructure work pays off weeks later. None of the individual changes moved the needle immediately. But they compound. The April traffic surge was strongly correlated with March infrastructure work.
- Long-tail technical content works. Nobody is competing for "mediapipe facemesh landmark 61 291 mouth corner left right." But people are searching for it. Write the content that answers specific questions, and you'll rank.
- Structured data is a moving target. I added FAQ schema expecting rich results, then Google dropped support for it entirely. The lesson isn't "don't bother with structured data." It's that you should keep up with what Google actually supports and not assume any single markup type will keep working forever.
What's next#
The obvious next step is improving CTR. I'm ranking on page one for hundreds of queries but barely getting clicks. Better titles and meta descriptions are the lowest-hanging fruit.
I'm also looking at the queries where I'm ranking position 8-15. With a bit of content improvement, some of those could move onto page one.
One thing I completely missed: Bing Webmaster Tools. I never submitted my site to Bing, which means I was invisible to Bing, DuckDuckGo, and everything else that relies on Bing's index. Three months of traffic left on the table. I've since set it up and plan to cover the impact in a follow-up post.
If you're building a dev portfolio and wondering whether blogging is worth the effort: yes. One good technical post did more for my visibility than a year of project pages.
The full implementation timeline and all commits mentioned in this post are available on GitHub.
Resources
- The blog post that drove 85% of all impressions
- Google Structured Data docs
- Ahrefs SEO blog
- How this portfolio was built
- The tech stack behind the site